Introduction: to Flowcharts
A flowchart is a visual map of an algorithm.
Instead of writing a wall of text, we use specific shapes to show exactly what is happening at every step.
Flowchart Components
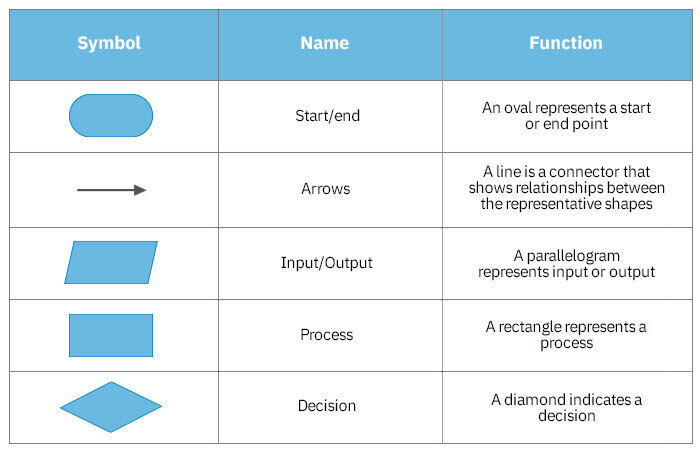
| Shape | Name | What it does | Example |
| Oval | Terminator Start / End | The “Terminator.” It shows where the logic begins and where it stops | “Start Program” |
| Parallelogram | Input / Output | Data entering or leaving the system. | Input: User name. |
| Output: Screen prints “Hello!” | |||
| Rectangle | Process | A task, action, or calculation. The “doing” box. | “Add 1 to Score” or “Calculate Total” |
| Diamond | Decision | A Yes/No or True/False question. This creates a split in the path. | “Is Score > 10?” |
Flowchart Components
Example of a Flowchart
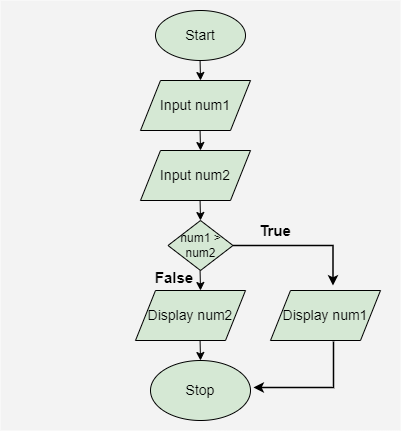
Draw a flowchart to input two numbers from the user and display the largest of two numbers.
Below is the algorimic logic you need to represent in your flowchart:
Stop: The process ends with the Stop symbol, signaling the conclusion of the program.
Start: The process begins with the Start symbol, indicating the start of the program.
Input num1: The first number, represented as num1, is entered.
Input num2: The second number, represented as num2, is entered.
Decision (num1 > num2): A decision point checks if num1 is greater than num2.
If True, the process moves to the next step where num1 will be displayed.
If False, the process moves to display num2.
Draw your flow chart and then click here for an answer .